


The Bowler Chart
Revolutionize your coaching, mentoring and performance reporting with real-time insights and dynamic KPI tracking

We have created the Bowler Chart to be a powerful new tool designed to empower leaders with proactive, data-driven insights for coaching and performance management. With the Bowler Chart, you gain a clear, visual snapshot of your key performance indicators over daily, weekly, and monthly intervals, enabling you to swiftly spot trends, benchmark to periodic averages and address challenges before they escalate. This innovative feature transforms traditional reporting into an actionable, intuitive experience, ensuring you can focus on what matters most: guiding your team to excel. Whether you're conducting team huddles, one-on-one sessions or reporting to the Senior Management Team, the Bowler Chart equips you with the precision and agility needed to optimize performance and drive strategic success. Explore our step-by-step guide below to learn how to access, navigate, and maximize the full potential of this tool in your leadership journey.
The KPI Connect Input Panel &
Bowler Chart Reporting
Discover KPIConnect-the ultimate solution for real-time KPI management designed to streamline performance tracking across teams. In this short explainer video, see how KPIConnect enables leaders to stay connected to their teams, update KPIs instantly, and drive accountability and alignment like never before. Join us to learn how to bring efficiency and clarity to your KPI program! Now, with instant access bowler chart reporting!
Webinar: Mastering Bowler Chart Reporting
The official recording of our KPI Management Webinar, where we explore the power of Bowler Chart reporting for transforming KPI tracking and driving proactive leadership. In this session, our Managing Director demonstrates how Bowler Charts can enhance daily, weekly, and monthly performance reviews-providing real-time insights to boost operational excellence.
The Bowler Chart
Access the Bowler Chart from the KPI Input Panel accessible from the widget menu
1. Click here to access the KPI Input Panel

2. Click here to access the Bowler Chart menu

3. Select 'Weekly' or 'Monthly' from the Bowler Chart menu

4. For the monthly bowler chart, choose the last date in the 12-month cycle you would like included.
(For weekly, choose the 1st date of the 7-day period you would like to report)

5. Use the date picker to select date

6. Click here to generate report

7. Congratulations! You have finished the exercise
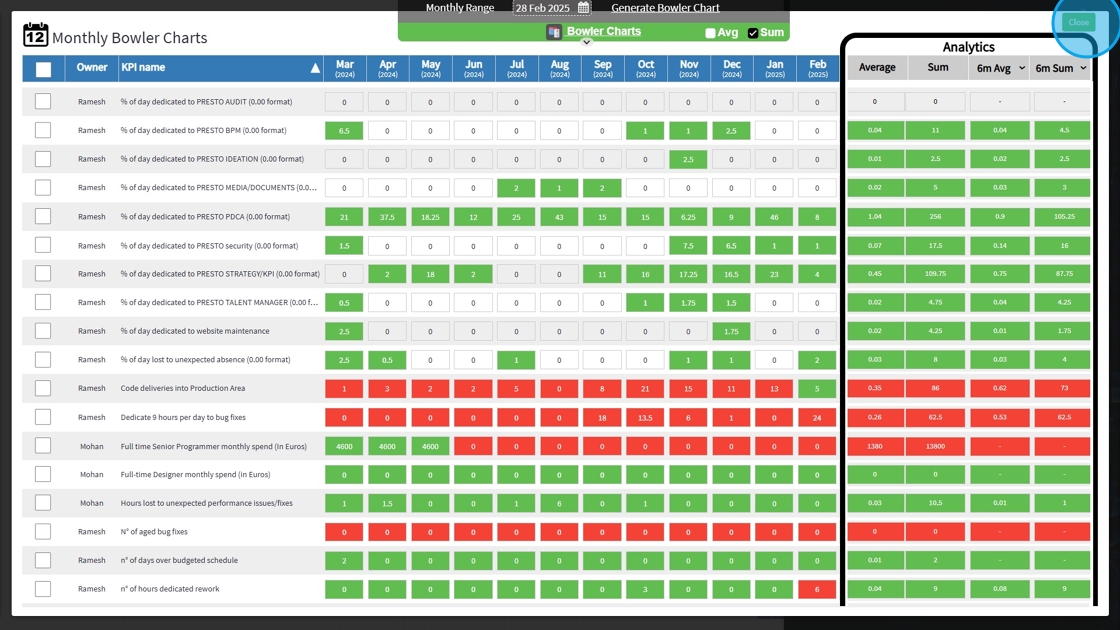
Tip: For the Monthly Bowler Chart, use the Avg & Sum selection box for the monthly display of data